
In the last post, we did some comparison between jokes.
This is a friendly light excursion to simple animation, a nice way to visualize our result. TFIDF is used to figure out what are the intersting topics of the joke corpus. The answer is pretty intuitive:
- Men v.s. Women
- Polititians & Celebrities
- Rabbi, Priest, other religious Joes
In the short future, I might write another blog on this, but not now.
statistics of jokes of the election week, Nov. 8th, 2016 (Scroll down for the animated version. This is a screen shot.)
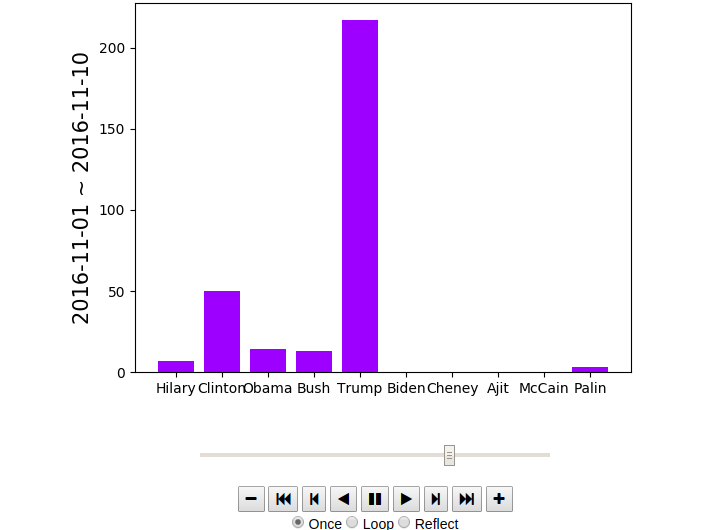
Source can be found here:
<!DOCTYPE html>
Let's assume those are the people we want to know more about
In [4]:
name_list = ["Hilary", "Clinton", "Obama", "Bush", "Trump", "Biden", "Cheney", "Ajit", "McCain", "Palin"]
In [1]:
from __future__ import division
import nltk
from nltk.stem.porter import PorterStemmer
import math
import numpy
import pandas as pd
import re
import numpy as np
In [2]:
jokes_df = pd.read_csv("all_r_jokes.csv", delimiter=',',quotechar='|')
jokes_df.columns=['id', 'timestamp', 'q', 'a']
create function so that we can count the appearance of each name
In [3]:
def countStr(doc,subs):
    if (doc is None ):
        print('doc is None')
        return 0
    if (not isinstance(doc, str)):
        print('doc is not a String')
        return 0
    doc = re.sub('[^a-z0-9]', ' ', doc.lower())
    return doc.count(subs.lower())
In [7]:
for name in name_list:
    jokes_df[name] = jokes_df.apply(lambda x: countStr(x['q'], name.lower()) + countStr(x['a'], name.lower()), axis=1)
Instead of registering boolean of which name occurs, store the information of occurance of each name in the joke. Boolean information can be deduced from occurance numbers, but not the other way around.
A peak of the info we hnave here:
In [9]:
jokes_df[jokes_df['Obama']>1].sample(2)
Out[9]:
Plot and animate the entire thing!
In [10]:
# get the list of timestamps to iterate over.
from datetime import datetime
years = range(2014, 2018)
months = range(1, 13)
timestamp_list = []
for y in years:
    for m in months:
        timestamp_list.append(datetime(y, m, 1).timestamp())
        timestamp_list.append(datetime(y, m, 10).timestamp())
        timestamp_list.append(datetime(y, m, 20).timestamp())
In [11]:
def toDateStr(t):
    s = datetime.fromtimestamp(s)
    return s.strftime('%Y-%m-%d')
compile data to plot
In [12]:
plt_data = []
for i in range(len(timestamp_list)-1):
    startt = timestamp_list[i]
    endt = timestamp_list[i+1]
    currjokes_df = jokes_df[(jokes_df['timestamp']>startt) & (jokes_df['timestamp']<= endt )]
    curr_name_count = []
    for n in name_list:
        curr_name_count.append(currjokes_df[n].sum())
    plt_data.append([startt, endt, curr_name_count])
In [13]:
import matplotlib.pyplot as plt
y_pos = range(len(name_list))

def animate(i):
    startt, endt, curr_name_count = plt_data[i]
    plt.cla()
    plt.bar(y_pos, curr_name_count, align='center', alpha=0.5, color='b')
    plt.xticks(y_pos, name_list, fontsize = 10)
    plt.yticks(fontsize = 10)
    start_time_str = datetime.fromtimestamp(startt).strftime('%Y-%m-%d')
    end_time_str = datetime.fromtimestamp(endt).strftime('%Y-%m-%d')
    curr_label = start_time_str + ' ~ ' + end_time_str
    plt.ylabel(curr_label, fontsize = 15)
    #plt.show()

#animate(77)
In [14]:
%matplotlib notebook
import matplotlib.pyplot as plt
from matplotlib import animation, rc
from IPython.display import HTML

fig=plt.figure()
n = len(plt_data)
anim=animation.FuncAnimation(fig,animate,repeat=False,blit=False,frames=n,
                             interval=500)
#plt.show()
HTML(anim.to_jshtml())

Out[14]:
</input>